
One of the most challenging aspects of my dissertation is figuring out how to analyze the development of four different park systems (Pennsylvania, Idaho, Ontario, and Alberta) over a period of about one hundred years. The sources tend to blur together in my mind, making analysis nearly impossible. I am a visual learner, and about a month ago I realized that I needed to figure out a way to visualize the changes in park systems through time.
I decided that an interactive timeline was likely my best option. After asking the #twitterstorian community for timeline software suggestions, I settled on tiki-toki-com. The first timeline is free on tiki-toki. I figured I could try one timeline and then decide whether I wanted to pay for the monthly subscription.
I chose Pennsylvania as my trial park system because it is the park system for which I have the most background knowledge. The main question that I want the timeline to help answer is: How did the type of land on which parks were created change over time? To do this, I researched the background of each park. *I also searched Google Scholar and Books for references to each park, which revealed that basically nothing has been written about most of these parks.
I identified seven main land categories and created a colour code to represent these different land categories on the timeline:
- Post-Timber (usually clear-cut and denuded land, often burnt by wildfires) = DARK GREEN
- Post-Industry (mines, iron furnaces, etc.) = BLUE
- Conservation (land that was saved specifically to save a piece of landscape or ecological feature)= RED
- Dams and Recreation (parks that were created on pre-existing lakes (almost all man-made), often the lakes were created specifically for the park for recreation purposes) = PINK
- Historical (Parks created specifically to preserve a historic site) = YELLOW
- Post-Agriculture (parks created on former agricultural land) = LIGHT GREEN
- Educational/Environmental (parks created specifically to house environmental education facilities) = WHITE
For some parks the category under which it fell was easy to figure out, however, for others it was not as clear and several categories might be suitable for one park. For instance, many of the post-timber parks also have man-made lakes originally created for the timber industry. I plan to continue to tweak the categories as I learn more about the parks. As the timeline stands, it is based on my first impressions of the historical accounts available to me.
After I plotted all of the parks based on their year of creation, I was pleasantly surprised at the results and the potential of the timeline to aid my research.
*I have not yet paid for the ability the embed my timeline, so I will have to settle for screenshots for this post.

In the above timespan, 1920-1940, one can see that the parks created during this time were almost exclusively created on post-timber (dark green) and post-industrial land (blue). This is significant because this is land that was basically abandoned, deemed useless, and thus acquired by the state for little to no money. My case study, Cook Forest State Park, is the red dot before 1930, one of the lone instances of conservation. Cook Forest was created to save the largest track of old-growth forest east of the Mississippi, yet it took almost twenty years and a public donation campaign to save it. Why? Because the state didn’t want to pay for it. And this timeline shows why that might be. Why pay a lot of money for a stand of big trees when other land is being acquired for park purposes for a fraction of the cost?

Fast forward to the 1950s, we can see the flurry of park activity during these three decades. One can also see that a vast majority of the parks are associated with dam-creation (pink). Either the parkland was purchased and a lake was created, or a lake was created for utilitarian purposes (often by the Army Corps of Engineers) and an adjoining park was established. One can also see how small a role conservation continued to play in the creation of parks in Pennsylvania through the mid-1970s.
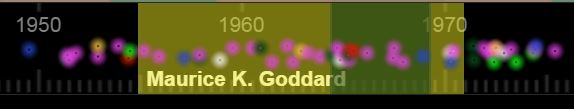
The timeline also allows one to overlay time-spans. Above I have overlaid the career of Maurice K. Goddard. Goddard, who served as the Secretary of the Pennsylvania Department of Forests and Waters from 1955-1970 and the Secretary of the Department of Environmental Resources (Pennsylvania) from 1970-1979, is largely responsible for the significant upswing in Pennsylvania park creation during the 1960s and 1970s. As explained in the following video, Goddard vowed to create a park within 25 miles of every Pennsylvanian:
If one then looks at park creation post-1980, below, two main points of observation stand out. Firstly, park creation slows down significantly. Secondly, it is not until the 1980s that conservation starts to play a main role in state park creation.

I have only scratched the surface of what this platform can do for me. For instance, the platform allows me to attach photos, videos, and descriptions to each park. I hope to give updates as I finesse the Pennsylvania state park timeline and try my hand at temporally mapping the park systems of Idaho, Ontario, and Alberta.


Wow, impressive!
LikeLike